- Historically, the duration of bull markets is 6.7 years, and the duration of bear markets is 1.2 years. On average, bear markets occur about every 7.1 years.
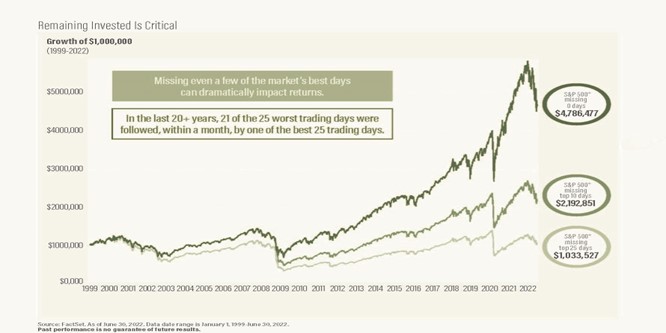
- Missing even a few of the market’s best days can dramatically impact returns. In other words, would you know when the most trading days are going to happen so that you could get out of the market, and then, would you also know the exact day to get back in the market to benefit from the best trading day?
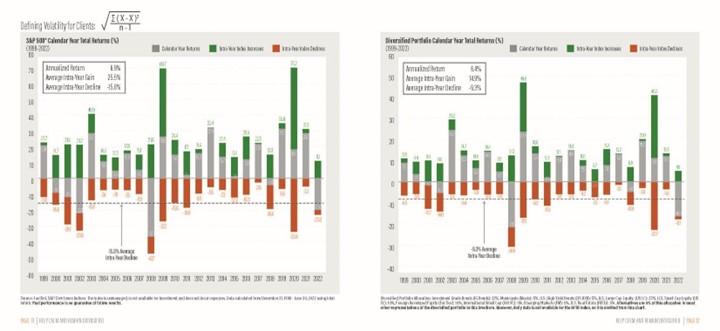
- Markets and portfolios can fluctuate dramatically in any given year. The two charts below illustrate annual fluctuations of the S&P (on the left) vs annual fluctuations of a diversified portfolio (on the right). Interestingly, during the time period between 1999-2002, the return for both is very similar. However, the volatility, or inter year gain or loss, is far less dramatic in the diversified portfolio.
While all of these statistics and graphs are useful, ultimately, we know that investing can be very emotional. Having a Financial Plan and strategy for managing all types of markets can help you visualize the bigger picture. We are always available to discuss this and other financial questions with you.In this quarter’s newsletter you will find Erik’s article on Fear and Greed, Sean’s article on Focusing On Your Financial Plan, our Quarterly Market Update and Moore After Hours (what we do when we are not at the office).
Markets have been moving pretty wildly this year. One, two, and three or more percent moves up or down in a day have become relatively common over the past 9 months. There are a number of factors that would make a particular index swing like that, but there are two main things that drive the market regardless of what period we are looking at: fear and greed.Most are familiar with the old investing adage “buy low and sell high”, but interestingly enough, few actually follow that rule. More often than not, people will buy when markets are near their peaks, and sell when they are near their lows. If investors know that they should be buying low and selling high, why are they doing the opposite? It comes down to emotion. During bull markets, people feel that they are missing out on all of the money that is being made, get greedy, and begin to invest. During bear markets, people begin to fear that they will lose their money, get fearful that markets are actually a casino, and will sell their investments. This is the nature of the fear and greed cycle, which is visually represented below:
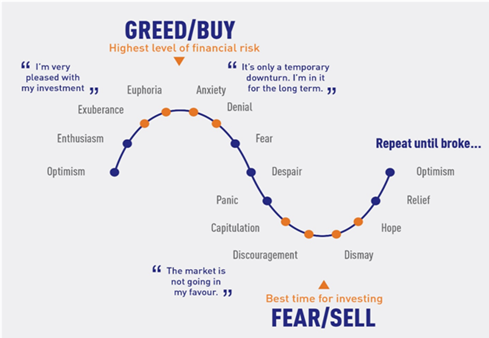 Now, this chart is not meant to imply that by understanding the fear and greed cycle, one can easily identify where the tops and bottoms of a market are. If that’s all it took, then all investors would never lose any money, and everyone would be rich. The reality is that timing markets is incredibly difficult, and even those who get paid millions of dollars to time markets are bad at it. To that point, this chart also does not suggest that an investor should be selling all of their investments at the euphoria or anxiety points, or that they should be investing irrationally large
sums of money at the discouragement or dismay points. What understanding the fear and greed cycle can do, is reign in emotions throughout the peaks and troughs, and create enough context to remain disciplined in an investment strategy.In times where markets are highly volatile, like now, it’s easy to question an investment strategy that has been underperforming recently, or even one that has been doing reasonably well. Fear can begin to creep in, which can create the desire to make a drastic change to your investments. However, history shows us that is a mistake. The graphics below take a look at two different behaviors that can drastically reduce the long term value of your investments: being uninvested for varying amounts of the best market days from 1980 – 2022, and how different investment tactics would have fared investing $2000 per year from 2002-2022.
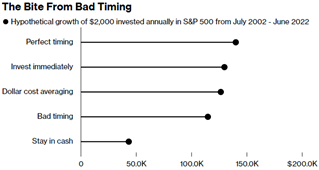
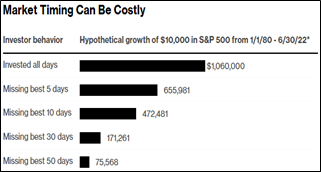 Source: FMRCo, Asset Allocation Team. *Growth reflects dividend reinvestment but not impact of taxes.Source: Schwab Center for Financial Research. *Cash example reflects Ibbotson US 30-day Treasury Bill Index. Stock examples include dividend reinvestment and exclude impact of taxes, expenses or fees.
From these graphics we can see that technically, there is a way to have better than normal performance by timing markets perfectly. But as mentioned above, timing markets is nearly impossible, and missing only a few of the best market days is detrimental to creating maximum investment value.At the end of the day, keeping emotions associated with the fear and greed cycle away from your investment decisions is the best way to get the most out of your money. Discipline in the face of anxiety or euphoria has been, and will continue to be the best way to invest. Making small changes to mitigate losses during bear markets or maximize gains during bull markets can be useful, but only when they stay in line with a long term investment strategy.At Moore Wealth, we create tailored portfolios for our clients that are based upon a disciplined process that takes into account long term goals, and the current market environment. If you are beginning to feel anxious about the current markets, or need help creating an investment strategy or financial plan, feel free to contact us.
Market Update for the Quarter Ending September 30, 2022
September Sell-off Caps Challenging Quarter
Equity markets saw widespread declines in September, bringing the major indices to their lowest closing levels for the year. The S&P 500 fell 9.21 percent during the month and 4.88 percent during the quarter; the DJIA fell 8.76 percent for the month and 6.17 percent for the quarter; and the Nasdaq Composite fell 10.44 percent for the month and 3.91 percent for the quarter.
Per Bloomberg Intelligence, as of September 16, 2022, with 99.8 percent of companies having reported actual earnings, the blended earnings growth rate for the S&P 500 in the second quarter was 8 percent. This is up notably from the estimates for 4.1 percent earnings growth at the start of earnings season.
While fundamentals were supportive during the quarter, technical factors were another story. All three major U.S. indices finished the month well below their respective 200-day moving averages for the sixth consecutive month.
Internationally, technicals were challenging. The MSCI EAFE Index lost 9.35 percent in September and 9.36 percent during the quarter. The MSCI Emerging Markets Index dropped 11.67 percent for the month and 11.42 percent for the quarter. Both indices finished September below their respective 200-day moving averages (as has been true every month this year).
Fixed income markets also experienced widespread declines due to rising interest rates. The 10-year Treasury yield rose from 2.98 percent in the second quarter to 3.83 percent in the third quarter, bringing long-term rates well above pre-Covid-19 pandemic levels.
The 2-year Treasury yield increased from 2.92 percent in the second quarter to 4.22 percent in September. Rising rates were driven by expectations for higher short-term interest rates from the Federal Reserve (Fed) this year and into 2023. The Bloomberg Aggregate Bond Index declined 4.32 percent for the month and 4.75 percent for the quarter.
High-yield fixed income also experienced sell-offs. The Bloomberg U.S. Corporate High Yield Index dropped 3.97 percent for the month and 0.65 percent for the quarter due to the rising rate environment and widening credit spreads in September. Spreads, however, finished the quarter largely unchanged.
Rising Rates Pressure Investors
Third-quarter market turbulence was primarily driven by rising interest rates, caused by increased investor expectations for higher short-term rates. The Fed hiked the federal funds rate a combined 150 basis points (bps) at its July and September meetings to slow economic growth and combat inflation, and more rate hikes are expected at the upcoming November and December meetings.
Long-term interest rates have been muted—the 10-year Treasury yield spent most of the post-crisis period below 3 percent—and the recent increase rattled markets. While this year’s rate increases and market volatility have served as a headwind, there are signs that the worst impact may be behind us.
Economic Growth Continues Despite Housing Slowdown
Housing performed well in 2020 and 2021, but rising mortgage rates and home prices have contributed to a sharp slowdown this year. The annual pace of existing homes sales fell to their lowest level in August since 2020. The pace of existing home sales peaked in January at a rate of 6.49 million sales per year, with sales declining every month since and ending August at an annualized rate of 4.8 million sales.
The national average 30-year mortgage rate increased from 3.3 percent at the start of the year to just over 7 percent in September. In the intermediate to long run, the slowdown in housing sales should help support the Fed’s attempts to combat inflation, but housing is currently a significant contributor.
Even though the housing sector was weak, the rest of the economy showed signs of growth. More jobs than were expected were added in July and August. Job openings are plentiful and the unemployment rate remained well below historical averages.
August saw solid retail sales and personal spending growth, with retail sales above economist estimates. The Conference Board Consumer Confidence survey for September showed consumer confidence at its highest level since April.
Business spending and confidence also showed signs of improvement last quarter. The ISM Services index indicated that service sector confidence increased in August to its highest level since April, and manufacturer confidence remained in expansionary territory during the month and quarter.
Core durable goods orders increased in both July and August, marking six consecutive months with increased orders. As you can see in Figure 1, core durable goods orders have been solid most of the year, even if the pace of growth has slowed.
Figure 1. Manufacturer’s Now Orders: Durable Goods Excluding Transportation, 2021–2022
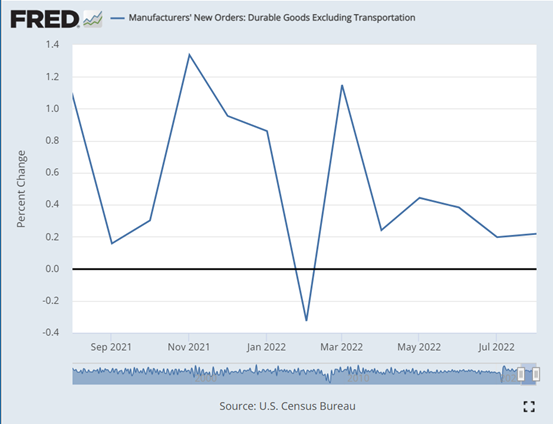
Source: U.S. Census Bureau
Overall, while there are signs that the Fed’s higher rates are starting to slow growth, with housing being the best example, the economy as a whole continues to expand.
Market Risks Remain Despite Growth
Even though the economy continues to grow, there are still very real risks to markets. Short-term market performance can be heavily impacted by other factors. While we’ve likely seen the worst impact from rising rates and high inflation on markets, it’s possible inflation will remain stubbornly high at year-end. The Fed’s restrictive monetary policy is also expected to continue slowing economic activity.
Beyond economic risks, the rest of this year also has political concerns. The U.S. November mid-term elections could see one or both chambers of Congress switching control, in addition to important state and local elections. There are also political risks abroad, including the continued Russian invasion of Ukraine and the general slowdown in global economic growth.
We’ve seen signs that inflation may be starting to slow and there is hope that the recent market pain has set investors up for better times ahead. Historically, periods with sustained sell-offs led to strong market returns. Despite short-term risks, the long-term picture is more encouraging.
Given the risks and potential for additional short-term shocks, a well-diversified portfolio that matches investor goals and timelines remains the best path forward for most. As always, you should reach out to your financial advisor to discuss your current plan if you have concerns.
All information according to Bloomberg, unless stated otherwise.