
Market Update
FOR THE MONTH ENDING march 31, 2020
Shocking month ends terrible quarter
March was another terrible month for stocks, capping off a turbulent quarter. The continued spread of the novel coronavirus led to even more fear and uncertainty in global markets. The S&P 500 declined by 12.35 percent for the month and 19.60 percent for the quarter. The Dow Jones Industrial Average (DJIA) did even worse, dropping by 13.62 percent for the month and 22.73 percent for the quarter. The Nasdaq Composite performed the best, but it still lost 10.03 percent in March, contributing to a 13.95 percent decline for the quarter.
These poor results came despite improving historical fundamentals. Per Bloomberg Intelligence, as of March 20, the blended average earnings growth rate of the S&P 500 for the fourth quarter of 2019 stood at 1.4 percent, with 99.6 percent of companies reporting. This is a solid improvement from the initial estimate of a 1.2 percent decline. It marks the first quarter with year-over-year earnings growth since the fourth quarter of 2018. Normally, this would be news worth celebrating. But with the shutdown of the U.S. economy and others around the world, past earnings growth is now much less relevant. Investors face significant uncertainty over what future earnings will be.
Technical factors displayed the breakdown in investor confidence. All three major indices ended the month below their respective 200-day moving averages. This result marked the second month in a row below this important trendline for both the S&P 500 and the DJIA. The Nasdaq Composite was a bit more resilient and managed to finish February above its trendline. But the selling pressure in March brought this index below the trendline by midmonth, where it stayed until month-end. This is an important technical signal, as prolonged breaks below this trendline could indicate a longer-term shift in investor sentiment.
Internationally, we saw large declines, as coronavirus case counts around the world spiked. The MSCI EAFE Index dropped by 13.35 percent for the month, leading to a loss of 22.83 percent for the quarter. Emerging markets fell by even more, dropping 15.38 percent for the month and 23.57 percent for the quarter. Beyond the viral crisis, international markets also suffered from rising dollar strength and falling oil prices. Technicals for international markets remained weak, as both indices finished March well below their respective 200-day moving averages for the second month in a row.
To some extent, investment-grade fixed income benefited from the global uncertainty during the quarter, but even here there was significant volatility. Investors fled to safe assets like fixed income, driving down interest rates. Rates were reduced even further by the Federal Reserve’s (Fed’s) March decision to effectively cut the federal funds rate to zero. As a result, the 10-year Treasury note dropped from 1.88 percent at the start of the year to 0.70 percent at the end of the quarter.
The sudden decline in rates disrupted financial markets. This led investors to flee to cash, which sent fixed income prices down, although they had largely recovered by month-end. The Bloomberg Barclays U.S. Aggregate Bond Index fell by 0.59 percent during the month, but it gained 3.15 percent during the quarter. High-yield fixed income, which tends to be more closely correlated with equities than with interest rates, fell by 11.46 percent for the month, contributing to a 12.68 percent decline for the quarter.
Coronavirus’s impact on American workers
Concerns about the coronavirus pandemic roiled markets in March, as the world came to grips with the severity of the situation. Mandatory shutdowns of schools, restaurants, sporting events, and most nonessential businesses drove home the real-world impact the coronavirus is having on daily life.
The social impact was immediate, but the economic effects only got started during March. The first data release to reflect the damage was the weekly initial jobless claims report for the week ending March 21. As you can see in Figure 1, 3.283 million Americans filed for unemployment. This was the highest weekly total of all time, well above the 665,000 we saw in March 2009 at the height of the financial crisis. This economic shock is what drove investors out of stocks and toward safer assets. With the social lockdown measures also shutting down large parts of the economy, it is almost impossible to tell what the full extent of the damage will be.
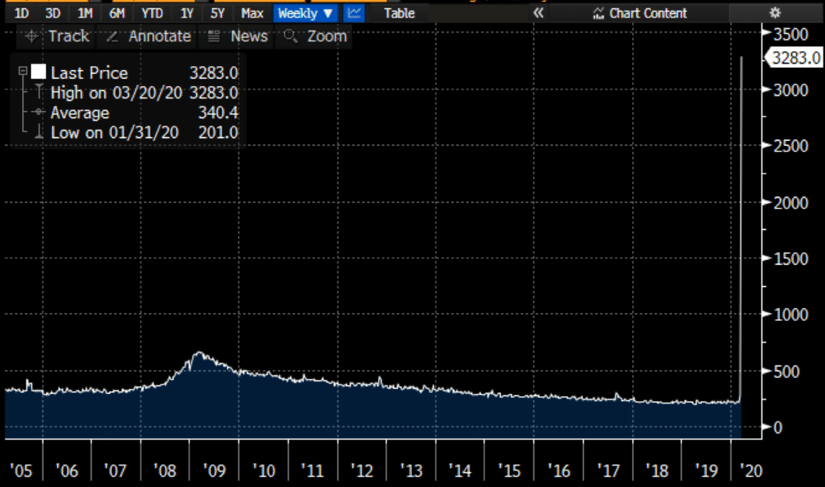
Source: Bloomberg
Fortunately, both the Fed and the federal government have stepped in to help keep the economy alive until it can restart. The Fed cut rates to zero and started a new round of quantitative easing, while the federal government put a $2 trillion stimulus plan in place to support worker incomes and small businesses.
This coordinated fiscal and monetary stimulus should help support the economy through the period of large-scale social distancing. In addition, another stimulus bill is already underway that would provide relief for states and individuals, as well as targeted support for the mortgage and travel industries.
The policy response to the coronavirus crisis in March is unprecedented in both magnitude and speed. The pandemic and the economic shutdown are damaging and will likely result in a recession. But the supporting measures, both current and pending, should keep the economy on life support until the country opens again. The financial markets seem to agree with this take, as the policy actions led to a partial recovery toward the end of the month.
The end of the beginning?
Although conditions remain difficult, there is some positive news as well. Here in the U.S., we have the benefit of watching how other countries have dealt with outbreaks. In places like South Korea and China, we have seen the positive impact enhanced testing and strict social distancing practices can have on slowing the spread of the virus and flattening the curve. We know what has to be done and are doing it across the country—and there is reason to believe it is working.
A good sign is that the number of new cases in the U.S. is growing more slowly. According to Worldometer, the growth rate has dropped by half. As we have seen in other countries, the decline in the growth rate of new cases is a necessary first step to stopping the spread. We are still far from containing the coronavirus outbreak in the U.S., but at least there is evidence that we are on the right track.
Financial markets are also staging a partial recovery, suggesting that the worst of that reaction may be behind us. While there will certainly be volatility—and markets may well drop again—we’re seeing signs that much of the panic has passed, and markets are now reflecting a balance of hope and fear.
Risks are here to stay
As we saw throughout the month and quarter, risks to economic growth and markets can spring up at any time and from anywhere. Given the nature of the coronavirus, we will see rising case numbers and deaths in the upcoming weeks. The economic updates will be grim as well. And looking forward, there is still a lot of uncertainty about the measures taken to combat the virus, which will likely drive further volatility.
There are very real reasons for hope, however, with signs that containment measures are having a positive effect domestically. The coordinated response from the federal government is also a positive for the economy and markets in these trying times. And with the large declines we’ve seen so far this year, markets are now pricing in a much broader pandemic and a tremendous amount of economic damage—things that may not materialize.
The economy and markets are now driven by reactions to the spread of the coronavirus and the government’s policy response. Although there are indeed signs of improvement, current conditions remain challenging and are likely to get worse before they get better. As investors, we need to remain focused on the long term. The coronavirus crisis is just the latest in a long line of events that will ultimately be overcome, but it is impossible to know how and when. Given that, and the volatile times we are in, maintaining a well-diversified portfolio that matches your goals and time horizon remains the best path forward.
All information according to Bloomberg, unless stated otherwise.
Disclosure: Certain sections of this commentary contain forward-looking statements based on our reasonable expectations, estimates, projections, and assumptions. Forward-looking statements are not guarantees of future performance and involve certain risks and uncertainties, which are difficult to predict. Past performance is not indicative of future results. Diversification does not assure a profit or protect against loss in declining markets. All indices are unmanaged and investors cannot invest directly into an index. The Dow Jones Industrial Average is a price-weighted average of 30 actively traded blue-chip stocks. The S&P 500 Index is a broad-based measurement of changes in stock market conditions based on the average performance of 500 widely held common stocks. The Nasdaq Composite Index measures the performance of all issues listed in the Nasdaq Stock Market, except for rights, warrants, units, and convertible debentures. The MSCI EAFE Index is a float-adjusted market capitalization index designed to measure developed market equity performance, excluding the U.S. and Canada. The MSCI Emerging Markets Index is a market capitalization-weighted index composed of companies representative of the market structure of 26 emerging market countries in Europe, Latin America, and the Pacific Basin. It excludes closed markets and those shares in otherwise free markets that are not purchasable by foreigners. The Bloomberg Barclays Aggregate Bond Index is an unmanaged market value-weighted index representing securities that are SEC-registered, taxable, and dollar-denominated. It covers the U.S. investment-grade fixed-rate bond market, with index components for a combination of the Bloomberg Barclays government and corporate securities, mortgage-backed pass-through securities, and asset-backed securities. The Bloomberg Barclays U.S. Corporate High Yield Index covers the USD-denominated, non-investment-grade, fixed-rate, taxable corporate bond market. Securities are classified as high-yield if the middle rating of Moody’s, Fitch, and S&P is Ba1/BB+/BB+ or below.
###
Moore Wealth is located at 50 Carroll Creek Way, Suite 335 Frederick, MD 21701 and can be reached at 301.631.1207. Securities and Advisory Services offered through Commonwealth Financial Network ®, Member FINRA, SIPC, a Registered Investment Adviser. This communication is strictly intended for individuals residing in the states of CA, CO, DE, MD, MN, NC, PA, VA, VT, WV. No offers may be made or accepted from any resident outside these states due to various state regulations and registration requirements regarding investment products and services.
Authored by Brad McMillan, CFA®, CAIA, MAI, managing principal, chief investment officer, and Sam Millette, senior investment research analyst, at Commonwealth Financial Network®.
© 2020 Commonwealth Financial Network®
RECENT POSTS
Don’t Touch Your Face, or Your Portfolio
Letter From Shabri Moore
Market Update for the Quarter Ending March 31, 2020
Market Update For The Month Ending February 29, 2020
Market Update For The Month Ending January 31, 2020
How Will The SECURE Act Affect Your Retirement?
Market Update for the Month Ending November 30, 2019
Giving Back to the Green Beret Foundation
Shabri Moore On Bloomberg Radio Podcast
Moore Wealth VIP Trip